Nov 25, 2019
We have released a series of interactive online dashboards which allow you to explore data from a range of sources showing the extent of gender imbalances in engineering.
The dashboards build upon the data and analysis presented in the EngineeringUK briefing 'Gender disparity in engineering', which provides a focused look into the underrepresentation of women in engineering and explores some of the barriers they face.
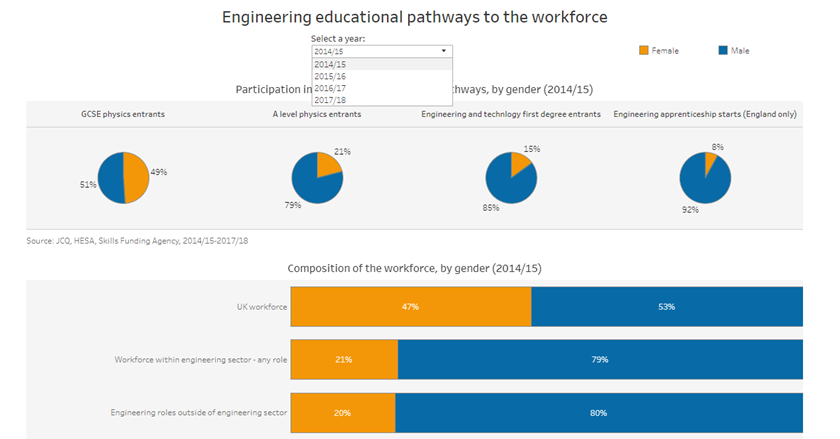
The dashboards show gender differences in participation and attainment in STEM subjects at every stage along the main educational pathways leading to a career in engineering. They also show gender differences in young people’s knowledge and perceptions of engineering, and, beyond this, differences in self-efficacy which could be deterring young women from pursuing engineering careers.
You can explore the data using the dropdown menus at the top of each dashboard to view the data by academic year, gender, educational level and more. Drilling down into the data in this way allows you to identify specific information you’re interested in, as well as to see how trends have changed over time.
This is the first time we've published data tables as interactive dashboards. The dashboards can be downloaded in different formats (for example, PDF, PPT and images), giving you the flexibility and control to display the information for a range of purposes.
< Back to News & Views